Knowing how to test the speed of an SSD lets you answer three practical questions: is my new drive performing as it should, has an older drive slowed down, and is a ‘slow computer’ complaint actually the storage at all. The method is straightforward — run a recognised benchmark under the right conditions, read the four or five numbers that matter, and compare them against the ceilings of your interface rather than against whatever flagship drive is in this month’s headlines.
Disclosure: As an Amazon Associate, ilcastellomenu.com earns from qualifying purchases. Links to Amazon on this page are affiliate links; they cost you nothing extra. Listing details such as price and availability change often, so check the current Amazon listing before you buy.
Done carelessly, though, a speed test misleads. Benchmark a drive that is nearly full, overheating, or connected through a slow port, and you will measure those conditions instead of the drive. This guide covers the preparation, the main tools for Windows, macOS and Linux, how to interpret sequential and random results, and how to tell a genuine problem — the kind How to Fix Slow SSD Speeds exists to solve — from a measurement artefact.
How to test the speed of an SSD properly: set up first
- Plug in and cool down. On a laptop, run on mains power with the drive at normal temperature; a drive benchmarked immediately after a huge file copy may already be heat-throttling.
- Close heavy background work. Pause cloud sync, game downloads, antivirus scans and backups. Anything else reading or writing the disk contaminates the result.
- Note the free space. SSDs benchmark best with room to spare and worst when nearly full. Record the fill level alongside results so comparisons stay honest — a drive at 95 percent full is not racing on a level field.
- Confirm the connection. An internal NVMe drive should be in its proper slot at its proper lane width; a portable drive should be on the fastest USB or Thunderbolt port, with the cable that came with it, not a charge-only substitute.
- Run the test more than once. Take two or three runs and use the typical result. Single runs wobble; patterns do not.
It also helps to know your interface ceiling before you start, because it defines what ‘correct’ looks like. SATA tops out around 560 MB/s; PCIe 3.0 x4 NVMe around 3,500 MB/s; PCIe 4.0 x4 around 7,000–7,400 MB/s; USB 3.2 Gen 2 portables around 1,050 MB/s. A result near the ceiling for your class means the drive is healthy and correctly installed, full stop — a point worth remembering when a forum post insists your drive is ‘slow’ for not matching a different class entirely. The class differences are laid out in NVMe vs SATA SSD.
In this guide
The main benchmarking tools, by platform
Windows: CrystalDiskMark and AS SSD
CrystalDiskMark is the de facto standard: free, quick, and the tool most review results are quoted in, which makes comparisons easy. Its default test reports sequential read and write (the SEQ1M Q8T1 line) and random 4K results. AS SSD Benchmark is the older alternative that additionally reports access times and gives a single summary score some users like for before-and-after comparisons. Either is fine; consistency matters more than the choice, so pick one and keep using it for your historical comparisons.
macOS: Blackmagic Disk Speed Test and AmorphousDiskMark
Blackmagic Disk Speed Test, free on the App Store, gives a simple read/write pair aimed at video workloads — ideal for a quick sanity check on internal or external drives. AmorphousDiskMark is the closer Mac equivalent of CrystalDiskMark, reporting sequential and random results in the same style, and is the better choice when you want the full picture, particularly for external SSDs where port and cable questions arise.
Linux: fio, KDiskMark and dd (carefully)
KDiskMark presents a CrystalDiskMark-style interface on Linux and is the friendliest option. fio is the professional’s tool — scriptable, precise, and unforgiving of sloppy parameters. A simple dd write test can smoke out gross problems but writes test data destructively if misused; reserve it for scratch volumes and know exactly which device you are pointing it at.
Whatever the platform, download benchmarking tools from their official sources only. Disk utilities run with deep system access, and a benchmark is not worth a compromised machine.
Reading the results: the numbers that actually matter
A benchmark report contains two families of numbers. Sequential speeds measure large, continuous transfers — the workload of copying a film, ingesting footage or backing up. Random 4K speeds (often labelled RND4K or 4K Q1T1 and Q32) measure scattered small reads and writes — the workload of booting, launching applications and general system responsiveness. The paradox newcomers hit is that the random numbers look tiny next to the sequential ones; a drive boasting 7,000 MB/s sequential may show 60–90 MB/s in single-queue random reads. That is normal physics, not a fault, and it is the random figures that correlate with how fast a PC feels.
Compare like with like. Your sequential result should sit reasonably near your interface ceiling and the drive’s rated figures — within roughly 10–15 percent is unremarkable, given test-file and system differences. Random results should be in the normal band for the drive class: NVMe drives far ahead of SATA, SATA far ahead of hard drives. If sequential numbers are right but the machine feels slow, storage speed is probably not your problem. If sequential numbers are half the expected ceiling, something structural is wrong — wrong slot, wrong port, throttling, or a drive in trouble — and the fix-it guide is your next stop: how to fix slow SSD speeds.
Write results deserve one extra caveat. Many drives post excellent short-burst write speeds thanks to a fast cache, then fall sharply on long transfers. A standard quick benchmark may only sample the burst. If your real work involves big sustained writes, run a larger test file size in the benchmark, or time a real copy of a very large file, and watch whether throughput collapses partway — that behaviour, and what to do about it, is covered in the slow-speeds guide and in the buying criteria of How to Choose an SSD.
Testing an external SSD (and why results disappoint)
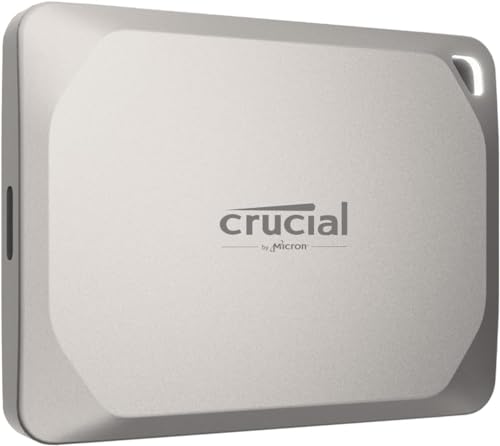
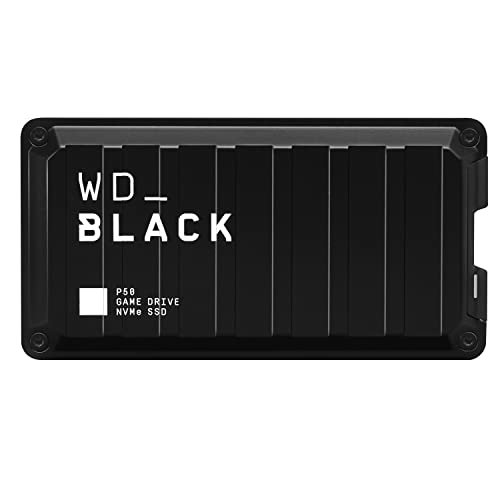
External drives add two variables internal drives do not have: the port and the cable. A drive rated around 2,000 MB/s needs a USB 3.2 Gen 2×2 port to show it, and that port is uncommon — Macs and consoles do not offer it at all, capping those drives near 1,050 MB/s (USB 3.2 Gen 2 / Thunderbolt behaviour) regardless of the box claims. Thunderbolt enclosures and drives run their own ceiling, roughly 2,700–3,200 MB/s in practice for current generations. Before concluding an external SSD underperforms, test it on the fastest port you own, with the supplied cable, and compare against the ceiling of that port rather than the drive’s headline.
Our portable roundups, such as the Best External Ssds for Gaming, are organised around exactly these real-world ceilings. If your test matches the port’s ceiling, the drive is fine and the bottleneck is the connection — useful knowledge before spending money on a ‘faster’ drive that would hit the same wall.
Testing after an upgrade or a clone
A speed test is the natural sign-off after two common jobs. After a fresh install (see How to Install an SSD), a benchmark confirms the drive is seated in a full-bandwidth slot and running at class speed. After cloning from an old drive (see how to clone to an SSD), it confirms the new drive is not somehow still bottlenecked by an adapter or a fallback mode. In both cases, save a screenshot or note of the results with the date and fill level: that baseline is gold six months later when you are trying to decide whether the drive has genuinely slowed or the machine just feels different.
Pair the speed check with a health check for the complete picture. Speed tells you how the drive performs today; SMART health data tells you how much life it has used and whether errors are accumulating. The two together — this guide plus How to Check the Health of an SSD — take five minutes and constitute a proper storage check-up.
Mistakes that produce meaningless results
- Benchmarking over a network or cloud folder. You measured the network. Always test the local device directly.
- Testing through a hub or a charge-only cable. Both can quietly halve an external drive’s speed.
- Comparing your random 4K numbers to a box’s sequential headline. Different workloads, different universes. Compare each figure to its own class norm.
- Running one test on a hot, full, busy drive and declaring it faulty. Fix the conditions, retest two or three times, and only then diagnose.
- Using benchmark results to judge game load times directly. Load times depend on CPU decompression and game engines as much as raw storage speed — see SSD vs NVMe for gaming for what storage upgrades really change in games.
A worked example: reading a real result
Suppose a new PCIe 4.0 drive reports sequential reads of 7,100 MB/s, sequential writes of 6,400 MB/s, random 4K reads around 75 MB/s at queue depth 1, and random writes around 220 MB/s. Interpretation: sequential figures sit within a few percent of the class ceiling — healthy. The random read figure, which looks absurdly small beside 7,100, is in fact normal and healthy for a single-queue workload; it is the figure most correlated with how responsive the machine feels. Conclusion: the drive is correctly installed and performing to class. No action, file the result as your baseline.
Now suppose the same drive reports sequential reads of 1,800 MB/s. That figure is far below the Gen 4 ceiling and suspiciously close to a PCIe x2 or Gen 2-style cap — the signature of a lane or slot problem, not a slow drive. The response is not to return the drive but to check which slot it occupies and what that slot is wired for, exactly the connection audit in the slow-speeds guide. Numbers only become diagnoses when compared against the correct ceiling; the same 1,800 MB/s from a USB portable on a Gen 2 port would be impossible (that port caps near 1,050), and from a SATA drive would indicate a measurement error. Context is the whole skill.
Testing methodology: test files, queues and what the presets mean
Benchmark tools let you choose a test file size, and the choice changes the answer. Small test files (a few hundred megabytes to 1GB) fit inside the drive’s fast write cache and report burst performance; large test files (16–64GB) outlast the cache and reveal sustained behaviour. Neither is ‘the truth’ alone — your workload decides which matters. If you copy phone photos, burst is your life; if you move video projects, sustained is. Serious reviews publish both, and your own testing should too when a purchase or a problem justifies the minutes it takes.
Queue depth is the other dial. A queue depth of 1 means the system issues one request and waits — the pattern of most desktop interaction. High queue depths (32 and beyond) simulate servers and heavy multitasking, inflating numbers beautifully and describing almost nobody’s home workload. When comparing your results with published ones, match the queue depth and test size before concluding anything; a Q1T1 figure and a Q32 figure from the same drive can differ by an order of magnitude, and both are ‘the drive’s speed’ under their stated conditions.
Testing internal versus external, boot versus data drives
Benchmarking the drive your operating system is running from adds noise: the OS itself reads and writes throughout the test. Expect slightly lower and more variable figures from a boot drive than from the same model tested as a secondary drive, and do not chase the difference — it is the sound of a computer being a computer. For the cleanest baseline of a boot drive, test right after a fresh boot with background sync paused, and accept the small residual variance between runs as normal.
External testing adds the enclosure variable. A bare NVMe drive in a USB enclosure benchmarks the enclosure’s bridge chip as much as the drive; two enclosures can make the same stick look like different products. When an external result disappoints, the controlled experiment is to test the bare drive internally (or the enclosure with a known drive) and see which half the disappointment follows. Purpose-built portables remove the guesswork by engineering the pair together, which is part of what their price buys.
When the numbers say ‘replace’ — and when they never do
A benchmark alone almost never justifies replacement. Drives performing at half their class ceiling have, in order of probability, a slot or port explanation, a heat explanation, a fullness explanation, or a settings explanation — all cheaper than a drive. The benchmark’s role is to detect and to verify: detect that something is off, then verify each fix by re-running the identical test and watching the figure move. Replacement enters the conversation only when a health check joins the benchmark in the witness box — errors logging, spares draining — at which point the speed was a symptom and the health report is the diagnosis.
Keep your baselines. A dated note — drive, fill level, four numbers — takes thirty seconds and converts every future ‘it feels slower’ into a measurable question. Owners who keep baselines replace drives on evidence; owners who do not, replace them on vibes, and vibes are an expensive diagnostic instrument.
Repeatability and honest record-keeping
A single benchmark run is an anecdote; three runs with the median taken are a measurement. Storage benchmarks wobble for mundane reasons — a background process woke, the drive’s cache state differed, the laptop decided the battery mattered more than your test — and the discipline of repeating and recording is what separates diagnosis from superstition. Record the tool, its version, the test size, the drive’s fill level and the machine’s power state alongside the numbers. That sounds like laboratory fussiness until the first time a six-month-old baseline, recorded properly, ends an argument about whether a drive has slowed: the argument becomes arithmetic, and arithmetic does not care about anyone’s feelings, including yours.
Store the record where future-you will find it — a note in the same folder as your other PC documentation, or a line in the health log this guide series keeps recommending. Baselines for speed and health belong together: performance says how the drive runs, health says how long it can keep running, and the pair of dated snapshots is the closest thing a home user has to a service history for the most important component in the machine.

Watching temperature while you benchmark: finding the throttle point
A single benchmark run tells you how fast a drive is when cool; a sequence of runs tells you how fast it stays. Thermal throttling is the main reason those two answers differ, especially for compact sticks in laptops and small enclosures. To see it for yourself, open a monitoring tool that logs drive temperature — the maker’s utility or a general hardware monitor — and run your benchmark back to back five or six times without pausing. Note the temperature at the start of each run and the sequential write score. On a well-cooled drive the line stays nearly flat. On a throttling drive you will watch the score step down as temperature climbs, often somewhere in the seventy-to-eighty degree Celsius range, and recover after a few idle minutes.
That curve is more useful than any single number because it predicts real behaviour: a drive that throttles on run three will also throttle halfway through restoring a large backup or installing a big game. If your workload is bursty — opening apps, loading levels, saving documents — brief peaks are all you ever ask for, and a throttle-prone drive may still serve you perfectly. If your workload is sustained, cooling is the fix to test next: a heatsink in a desktop, a thermal pad making proper contact in a laptop, or simply airflow across the slot. Re-run the same sequence after the change and compare curves, not peaks. The discipline of testing the same way twice is what separates diagnosis from guessing, and it pairs with the repair steps in our guide to fixing slow SSD speeds.
Sustained-write testing: the long copy, done deliberately
Standard benchmarks write for seconds. To learn how a drive handles minutes, run a deliberate sustained test: copy a set of large files — tens of gigabytes in total, such as a folder of video files or a disk image — from another fast drive or a RAM disk, and time the whole operation while watching the transfer graph. Most operating systems draw that graph for you in the copy dialog or a performance monitor. The shape tells the story: a flat line means the drive sustains its speed; a high plateau that falls off a cliff partway through marks the exact moment the write cache emptied, and the level it lands on is the drive’s honest long-copy speed.
Two cautions keep this test fair. First, the source must be faster than the destination, or you are measuring the wrong drive — copying between two similar SSDs measures the slower of the pair. Second, let the drive rest and cool between attempts, and test at a realistic fill level: a nearly full drive has a smaller cache and more housekeeping to do, so its sustained figure will be lower, and that lower figure is the one your future self will actually live with. Record the total data copied, the elapsed time and the fill level alongside the result. A single average number without those notes is trivia; with them, it is a measurement you can compare against next year.
Acceptance testing: putting a new or second-hand drive through its paces
The best moment to test a drive thoroughly is the day it arrives, inside the return window, before your data depends on it. A sensible acceptance routine has four parts. First, verify identity and capacity: check the model and serial in a health tool against the packaging, and confirm the reported capacity matches what you bought — counterfeit drives that fake their capacity exist, and a full-surface write-and-verify pass with a validation tool exposes them by actually filling the drive and reading everything back. Second, record the health baseline: zero errors, zero reallocated blocks, and a power-on count that makes sense for a new drive. A supposedly new drive showing hundreds of hours is a return, politely but firmly.
Third, run your standard benchmark set and compare against independent reviews of the same model, allowing for your system’s generation and slot limits. A drive performing near its reviewed figures on your machine is healthy; one performing at half speed deserves investigation while returning it is still easy — start with the connection and slot checks elsewhere in this guide before blaming the drive. Fourth, do one real sustained copy of the kind described above, because that is the test that surfaces cache behaviour no short benchmark reveals.
Second-hand drives deserve the same routine with one addition: weigh the health report’s total bytes written against the model’s endurance rating before deciding the drive has a future as anything important. A lightly used drive with a clean report makes a fine secondary or portable disk. A heavily written one is a scratch drive at best, whatever its benchmarks say, because speed tests measure today and endurance decides tomorrow. Our explainer on what TBW means on an SSD walks through that judgement in detail.
Mapping test numbers to your actual workload
Benchmarks publish a menu of figures; your workload eats only a few of them. The translation skill is matching the two. If your machine feels slow starting applications and juggling windows, the figures that describe your life are the low-queue-depth random reads — the 4K QD1 numbers — because that is what an operating system does all day: fetch many small pieces, one or two at a time. If you edit video, sequential reads and writes at realistic file sizes describe scrubbing and exporting, and the sustained-write behaviour matters more than any peak. If you run virtual machines or a local database, random performance at moderate queue depths and latency consistency decide responsiveness, and a drive with modest peaks but tight, predictable latency can feel faster than a peaky flagship.
A quick workload translator
- Everyday responsiveness and boot behaviour: prioritise 4K random read at QD1 and overall latency.
- Game loading: sequential reads plus QD1–QD4 random reads; capacity and thermals matter as much as either.
- Content creation: sustained sequential writes after the cache, plus strong sequential reads for playback.
- Virtual machines and compiling: random read/write at QD4–QD32 and consistent latency under mixed load.
- Backup target or archive drive: sustained write speed and endurance; peak figures are nearly irrelevant.
Testing with this map in hand changes what you record. Instead of saving one headline score, save the two or three figures your workload actually consumes, plus temperature and fill level. When the machine feels different in six months, re-running the same focused test tells you whether the drive changed or your perception did — and it keeps you from replacing healthy hardware on the evidence of a number that never mattered to you.
Latency and consistency: the figures behind ‘feel’
Two drives can post near-identical throughput scores and feel completely different in use, because feel is governed by latency — how long each individual operation takes — and by how consistent that latency is. A drive that answers most requests in a fraction of a millisecond but occasionally stalls for a hundred times longer will produce the micro-hitches users describe as a machine that is fast but somehow not smooth. Those stalls usually trace back to the controller pausing for garbage collection or cache management, and they show up in testing as poor high-percentile latency: the 99th-percentile figure, not the average.
Some tools expose this directly; where yours does not, you can infer it. Run a random-read test for a longer duration and watch whether the score stays steady or sags and surges; check reviews that publish latency distribution graphs for any drive you are evaluating seriously. For most home users this is a tiebreaker concept rather than a shopping obsession — any modern drive from a reputable maker has acceptable consistency for everyday work. It becomes decisive in latency-sensitive roles: audio production, where a stall can ruin a take; competitive gaming at the margins; and any always-on service where users notice pauses. Knowing the concept explains the otherwise mysterious gap between benchmark winners and the drives people describe as feeling right.
Comparing your results with published reviews without fooling yourself
Sooner or later everyone puts their numbers beside a review’s and worries about the gap. Before worrying, align the variables the review controlled and you may not have. Review benches usually test a bare secondary drive, freshly secured-erased, on a current high-end platform, at a stated fill level, with the newest firmware. Your drive is probably the system disk, months into service, partly full, sharing attention with an operating system that is indexing, updating and syncing in the background. Each of those differences shaves the figures; together they easily explain a gap that looks alarming in a headline comparison.
The honest comparison is narrower: same tool, same test size, same queue settings, and your drive tested as a secondary disk if you want to chase review conditions — or, more usefully, your drive today against your drive’s own earlier results under the same conditions. That longitudinal comparison is the one with diagnostic power. A drive that has lost a third of its QD1 random-read performance since its baseline, on the same machine with nothing else changed, is telling you something real about cache state, fill level, thermals or health. A drive that scores lower than a reviewer’s open bench is mostly telling you that you do not own an open bench.
Firmware deserves a line in every comparison, too. Makers do change performance characteristics in updates — sometimes improving sustained behaviour, sometimes trading peak figures for stability. Note the firmware version in your records with each test, so a sudden change after an update reads as an explanation rather than a mystery.
Testing RAID, Storage Spaces and other combined volumes
Everything in this guide so far assumes one drive answering for itself. Combined volumes — two drives mirrored or striped by a motherboard RAID controller, Windows Storage Spaces, or a software array on Linux — answer as a team, and the tests need interpreting differently. A benchmark against the volume measures the array’s behaviour: a mirror often reads like a single drive or a little better, a stripe can post sequential figures near the sum of its members, and neither result tells you whether one member is quietly failing or throttling. For that, you drop to the individual drives’ health data, which the array tools or the drives’ own utilities still expose.
Test combined volumes for the question you actually care about, which is usually behaviour under failure and rebuild rather than peak speed. If your setup allows it, rehearse: pull or disable one member in a controlled way, confirm the volume stays available, and time a rebuild with a replacement. The rebuild period is when a second failure hurts, and knowing whether yours takes an hour or a day changes how urgently you keep a spare on the shelf. Record the volume-level benchmark too — after a rebuild, matching the old figure is a quick confirmation that the new member is performing and configured like the one it replaced.
Building a five-minute quarterly test habit
The record-keeping advice elsewhere in this guide only pays off if the tests actually recur, and they recur only if they are small. So shrink the routine until it fits inside five minutes, once a quarter, on a calendar reminder. The whole protocol: note the drive’s free space, run one short benchmark with your saved settings, glance at the temperature it reached, and save the result next to the previous ones with the date and firmware version. That is all. You are not auditing the drive; you are taking its pulse often enough that a trend has somewhere to appear.
Trends are what you are buying with those five minutes. A single mediocre score is weather; three declining scores in a row are climate, and climate is what justifies action — freeing space, improving cooling, updating firmware, or planning a replacement while the drive still works and cloning is still easy. Pair the quarterly test with a health check on the same reminder, since the two together take under ten minutes and cover both halves of the story: how fast the drive is, and how much life it reports having left. Our walkthrough on checking the health of an SSD is the natural companion piece.
Queue depth, thread counts and test size: the three dials that change every score
Benchmark results move so much with their settings that comparing scores without them is meaningless, so it is worth understanding the three dials properly. Queue depth is how many requests the tool keeps outstanding at once. An operating system starting programs lives at depth one or two; a server copying between fast drives may reach thirty-two. Tools that test at high queue depths flatter drives with strong parallel controllers, which is why the same drive can post a spectacular figure in one preset and an ordinary one in another. Neither is lying; they are answering different questions, and only one of them is the question your daily use asks.
Test size matters because of caches at every level. A small test file can live partly in the drive’s fast write cache and even in system memory buffers, producing a portrait of a drive that only exists for the first few seconds of real work. Larger test sizes — several gigabytes — force the drive to show its steadier behaviour, at the cost of more wear per run and longer tests. Thread count, the third dial, spreads requests across processor cores; raising it mainly helps saturate very fast drives on powerful machines, and on modest hardware the processor itself can become the ceiling, which then gets misreported as a slow drive.
The practical takeaway is boring and powerful: pick one sensible configuration — a multi-gigabyte test size, the tool’s standard queue settings — write it down, and never change it for your own drives. Consistency converts a benchmark from entertainment into an instrument. Reviewers change dials to explore; owners should fix them to compare.
What a speed test cannot tell you
A benchmark measures a drive performing synthetic patterns in a clean moment. It cannot measure how the drive behaves in month nine, full of fragmented free space and background tasks; it cannot measure reliability, which is a property of populations and time, not of one afternoon; and it cannot measure the things users often actually feel — a stutter caused by a driver, a pause caused by an antivirus scan, a load screen dominated by the processor decompressing data. Treating a good benchmark as a certificate of overall health is the mirror image of treating a bad one as a death sentence, and both mistakes send people shopping for drives they do not need.
Speed tests also say nothing about data safety. A drive can benchmark beautifully while its spare-block count quietly dwindles or its error log fills — which is why this guide keeps pairing speed with health checks, and why the decision to replace a drive should never rest on throughput alone. Use each tool for its own question. Benchmarks answer ‘how fast, today, under these settings’. Health data answers ‘how worn, and is anything failing’. Your own experience answers ‘does this machine feel right’. When all three agree, you know something. When they disagree, the disagreement itself is the clue worth chasing.
Testing in a second machine: isolating the drive from the system
When a drive’s results look wrong and every software check passes, the cleanest experiment is to move the drive — or the test — to different hardware. An SSD that posts the same disappointing figures in a second, known-good machine has told you the problem travels with the drive; one that performs properly elsewhere has told you the problem lives in the first system’s slot, settings or cooling. A USB enclosure makes this test easy for a quick sequential check, but remember its ceiling: judge the drive against the enclosure’s known limit, not the drive’s specification, and use a direct internal connection for any verdict that matters.
This isolation step is also the fairest way to test a drive you are about to sell, give away or return. Run your standard test set, save the results alongside the health report, and you have an honest description of the drive’s condition that protects both sides of the handover. Sellers who provide those two documents rarely argue with buyers later, and buyers who ask for them rarely inherit surprises.
A word on benchmarking other people’s machines
Testing a drive in a machine that is not yours — a family member’s laptop you are helping with, a colleague’s desktop — carries one extra responsibility: leave the system as you found it. Benchmarks are read-only in spirit but not entirely in practice; they write test files, fill caches and, in the case of a nearly full drive, can push a struggling system into swapping or errors. Check free space before you run anything, close the owner’s work first, and delete your test files afterwards. And report results with their context attached — an ageing laptop’s drive scoring modestly in a warm room with three percent free space is not a failing drive, and saying so carelessly can send someone shopping, or worrying, for no reason at all.
The shortest honest summary of all of this
Test the same way every time, record what you find with its date and context, judge the drive against its own past before judging it against anyone else’s bench, and let health data share the decision whenever speed raises a question. That is the whole method, and it works on every drive you will ever own.
Gear mentioned in this guide
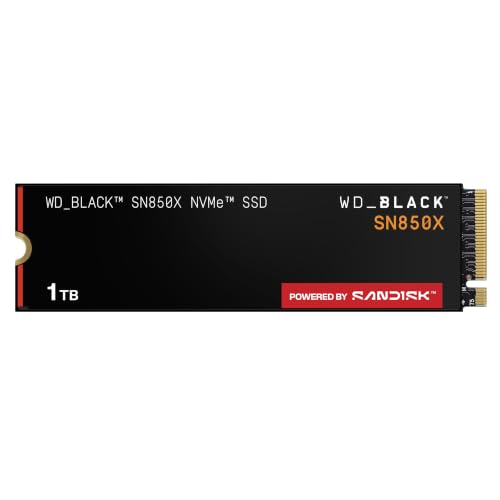
WD_BLACK SN850X 1TB NVMe SSD — a PCIe 4.0 reference point: a healthy install should benchmark near the top of the Gen4 class in sequential tests. Check on Amazon

Crucial MX500 1TB SATA SSD — a SATA reference point: expect sequential results in the mid-500 MB/s range — the interface ceiling, not a fault. Check on Amazon
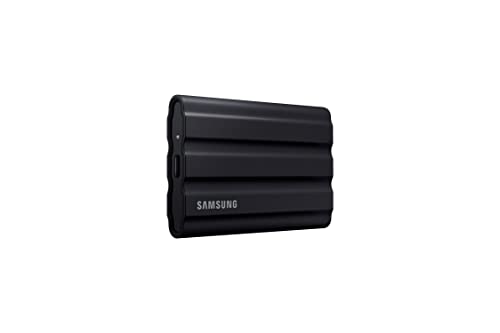
Samsung T7 Shield Portable SSD 1TB — a USB portable reference: expect results near 1,050 MB/s on a USB 3.2 Gen 2 port. Check on Amazon
Frequently asked questions
What is a good SSD speed test result?
One that sits near the ceiling of your interface class: roughly 500–560 MB/s sequential for SATA, 3,000–3,500 for PCIe 3.0 NVMe, and 5,000–7,400 for PCIe 4.0 NVMe, with random 4K figures in the normal band for the class. Judge against your class, not against the fastest drive sold.
Why is my SSD’s 4K random speed so much lower than its sequential speed?
Because scattered small reads are fundamentally harder than one long continuous read. Every drive shows this pattern; the ratio is normal. Random performance is what makes a system feel responsive, and NVMe drives lead SATA drives substantially on exactly this measure.
How often should I benchmark my SSD?
Benchmarking is diagnostic, not maintenance. Run it when the drive is new (to save a baseline), after a major change like a clone or slot move, and when you suspect a problem. Repeated benchmarking does not harm a drive in any practical sense at this scale, but it also tells you nothing new when nothing has changed.
My write speed drops during long copies but the benchmark looks fine. Why?
The benchmark sampled the drive’s fast write cache. On long transfers the cache fills and speed falls to the NAND’s sustained rate, which is much lower on many models. Use a larger test size or time a real large-file copy to see sustained behaviour.
Can a speed test damage or wear out my SSD?
A normal benchmark writes a few gigabytes of test data — trivial against an endurance rating measured in hundreds of terabytes. Do not leave stress-test loops running for days, but ordinary testing is not a wear concern.
The test says my external SSD is half its advertised speed. Is it faulty?
Probably not — the port is the likely ceiling. A 2,000 MB/s-class drive needs USB 3.2 Gen 2×2, which many machines lack entirely. Test on the fastest port with the supplied cable and compare against that port’s ceiling before blaming the drive.
Why do two benchmarks give my drive different scores?
Because they test differently: file sizes, queue depths, test duration and whether they measure burst or sustained behaviour all vary. Compare a drive only against results from the same tool with the same settings, or against the broad class ceilings this guide lists.
Should I test with the drive empty or in normal use?
Test in normal use for a truthful picture, and note the fill level with the result. An empty-drive test shows best-case behaviour that your drive will only exhibit in its first week of life; a 70-percent-full test is the number your daily experience is actually built on.
The bottom line
Test under fair conditions, compare against your interface ceiling, and read random and sequential numbers as answers to different questions. Most ‘slow SSD’ results turn out to be a port, a cable, a full drive or a hot drive — all fixable without replacing anything. Save a dated baseline when things are good, and you will always know whether a future problem is real or imagined.